Trump’s Legacy

Three organizations (APSA, Siena and C-Span) provided rankings of US presidents. These rankings were based on surveys of historians, generally from well known universities. The APSA (American Political Science Association) and Siena (Siena College Research Association) were done in 2018, so they do not reflect the last two years of Trump’s term in office.

Donald Trump was 45th president of the United States, however since Grover Cleveland was the 22 and 24th president, it means there were really 44 presidents. It is convenient to divide these rankings by quartiles, as ranks 1 to 10 are the top ranked presidents and 34 to 44 are the lowest ranked presidents. Wikipedia has consolidated these surveys and also provides a breakout of the ranking of various factors, such as integrity and leadership of each of these surveys.

Trump is considered one of the five worst presidents in these three surveys. C-SPAN rates Trump as the fourth worst president in history.

SurveyTrump (#45)Pierce (#14)Buchanan (#15)Andrew
Johnson (#17)
Harding (#29)
APSA (2018)4441434039
Siena (2018)4240434441
C-SPAN (2021)4142444337
Ranking of Donald Trump in the lower fourth quartile

Since Harding’s term was from 1921 to 1923, the surveys rank Trump at a level not seen about 100 years. So, what qualities are lacking in Trump and the other presidents in this table? Siena ranks Trump as the worst (rank = 44) in the areas of background, integrity, ability to compromise and executive appointments. Interestingly, he has high rating in “luck” and is in the third quartile in “willing to take risks.”

Similarly, C-Span (2021) puts Trump last of all presidents in the category of moral authority and administrative skills. He is in the bottom of the fourth quartile as are Pierce, Johnson and Buchanan in all categories (crisis leadership, economic management, international relationship and relations with congress) with the notable exception of public persuasion, where he is the ranked in the third quartile.

His continual stream of lies did not go unnoticed by the scholars. Getting the lowest ranking of any president in integrity (Siena) and moral authority (C-Span) reflect this. Donald Trump was never very interested in the truth, as his narratives were generally built on a stack of lies.

Being ranked lowest in “background” is pretty bad, but I believe accurate, as he never held office prior to being president.

The president is elected to do what is best for the country and not himself. This is part of the moral authority that great presidents have displayed. The January 6 committee will have public hearings in the spring, and will, I am certain, show Donald Trump had total disregard for the constraints of presidential power in his attempt to alter the outcome of the 2020 election. It is unprecedented in American history.

So what is this quality missing from these surveys? I guess it is “humility and respect” which Trump was not. He was arrogant and disrespectful of the system.

Stay tuned,

Dave

Links:

Wikipedia: Historical Ranking of US Presidents

Siena College US President Study Historical Ranking
Trump’s Approval

Trump’s approval rating has  increased from 39% on October 1 -13 to 45% on Dec 2 – 15 and numerous commentators have mentioned this as a sign of Americans disapproval of impeachment.  This is really hard to say, because other polls show a high percentage of Americans support the impeachment.   Polls always contain noise and no commentator likes to say the polls are inconclusive, but that may be the truth.   A 6% change over 3 months, is not particularly significant and I look at graphs to identify trends.   Gallup tries to pick a random representative sample but surveys are always imperfect.   The links provided below are the best ones I could find.  Time will tell if there really is a trend as a result of the House actions yesterday.

The country is divided.   Except for brief periods of extreme events, it has been this way for the past two decades.  A breakdown of approval ratings, shows a rock solid support by Republicans (89%) and a similar lack of approval by Democrats (8%).  This recent small uptick in approval ratings seem to be coming from independents, who show a 10% increase in approval ratings over the last 3 months, to 43%. approval.

The really striking feature of Trump’s approval ratings, as compared to the past 12 presidents from Truman to Obama, is how flat  (little variability)  his approval ratings have been to date.   He never gets above 50% or below 35% in the polls.   So, the variability as measured by Trump’s high to low is around 15%.  Obama’s was 25%.  George W. Bush ratings ranged from 90% to 25%, or an incredible 65%.   Bush became extremely popular right after the 9/11 attack in 2001, and then his popularity began to slide as the US attacked Afghanistan and Iraq.

Without any extreme event,  approval ratings often hit their  high mark  in about the first 100 days following inauguration of the first term.   Obama had his  highest approval ratings (62 to 67%) from January to May, 2000 in the honeymoon period.   G. W. Bush had a similar honeymoon period of  57 to 62%, however this approval rating soared immediately after 9/11.   Neither Clinton nor George H.W. Bush had their highest ratings during the  honeymoon period of their first term,  but both Reagan and Carter did.  What sent George H.W. Bush’s ratings through the roof (89%) was the beginning of the Iraq war.

Nixon’s approval rating was generally quite high (above 50%) even though the perception is that he was an unpopular president due to the numerous anti-war rallies.  He was re-elected in Nov 1972 in a landslide election, and definitely enjoyed high approval of 67% in the first week of the honeymoon period.  The Watergate scandal galvanized public opinion in October 1973  with the battle for the tapes and the  firing of  the Special Prosecutor Cox, termed the “Saturday Night Massacre.”  Nixon’s approval ratings sank to below 30% in October  and never recovered in the next 10 months before his resignation.

Returning now to Trump’s flattish (trendless)  ratings and coming events,  In January,  the Senate will acquit Trump of the two articles of impeachment.  The headlines from the New York Times, Washington Post and all the print media that Trump hates so much , will have in big bold letters “The Senate Acquits Trump.”   This should help fuel his rallies.  Whether this translates into a boost in ratings, we shall see.

If Trump can sustain  approval ratings above “the line”  (50%) I will immediately concede that impeachment boosted his approval.   Likewise, if the Gallup approval  ratings fall in the usual range (35 to 45%), then the conclusion should be that impeachment had no discernible affect.   Sinking below 35% is rare, but it could happen, particularly if the Democrat campaign intensifies.

A couple caveats:  (1)  It takes time to do polling, so the period to watch is 4 to 8 weeks after the acquittal and  (2) I use Gallup polls for consistency.   I’ve included a link for the 538 website, which compares many surveys, and gives each of them a score.  Trump seems to do better by a couple of percentage points, when surveys include likely or registered voters.   I would think these surveys are better indicators of results of the 2020 election.

A final caveat is that surveys only ask if one approves of the president’s performance.  The 2020 election will give voters a chance to select which of presidential candidate they feel would best lead the country.   Obviously, the big unknown is the registered voters who do not vote. Also, to win an election, you have to be get a majority of votes in the swing states (PA, FL, MI, AZ, etc), not necessarily be the most popular in the country.

Stay tuned,

Dave

Links:

Gallup poll 

(you can select various presidents, and their support from Republicans, Democrats and Independents)

Wikipedia – Presidential Approval Ratings (historical) 

Wikipedia = Presidential Approval Rating (Trump)

538 Website

(shows about an even split on those for and against impeachment.


2020 Election forecasting

I saw a headline that Moody had an election forecast model which shows Trump wins by a landslide.  I thought immediately that this can’t be.  Landslides happen when a very popular president runs for re-election, and wins big in certain key states.

Moody has a forecast model, which uses economic variables to predict election winners.   They produced 3 elections scenarios:  (1) Democrats win by a narrow margin (2) Republicans win by a narrow margin and (3) Republicans win by a wide margin.   The difference in these three models is the % turnout of the opposition party (Democrats) in the election.   Republicans win if this % Democratic turnout is average or below average.  Democrats win with a high Democratic turnout.  Of course, this turnout will not be known until after the election.   It is really what every election strategist will tell their candidate, that it isn’t enough to get people to agree with you,  you have to get them to vote for you.

Rule 1:  You need to fire up your base at election time or at least more than your opponent.

Moody’s work predicts every outcome but a Democratic landslide.   Moody’s considered 3 models, all using economic data, state-by-state.  I’ve included their model description in the links.   The approach passes my quick “six state reasonable check.   Regardless of the model and turnout,  Republicans win in TX 38,  GA 16, and TN 11 while Democrats win CA 55, NY 29 and IL20.  Postal  codes are followed by the electoral votes (EV)).   Moody predicts that all toss up states go to Trump when Democrat turnout is low or average.  I’m skeptical of this result.   They include all elections from 1980 to 2016.  I believe the earlier elections with Reagan victories may have skewed their results.  No candidate can win in New York, California and Texas anymore.

I’m particularly skeptical of Moody’s  wide margin win case,  with Trump beating Democrats  380 to 158 electoral votes.  That’s a solid win but not a landslide by historical standards.   Crushing victories haven’t happened for 3 decades.   The more recent landslides  were: 1972 Nixon vs.  McGovern with 520 EV,  1980 Reagan vs. Carter 489 EV and 1984 Reagan vs Mondale 525 EV.   Yet Reagan crushed Carter in 1980, he won just 50.7% of the popular vote. Nixon won by a landslide and a solid popular vote of 60.7%, yet resigned two years with the Watergate scandal.   I won’t go there- this blog already getting long!

Rule 2: You don’t have to be popular in every state, just the ones that count.

I tried to compare Moody’s work to everyone else making forecasts, but it just got too complicated.  I’m sticking with my  list of 5 solid toss up states of MI 16,  WI 10, PA  20. FL 29 and AZ 11, made on my Aug 19 blog. I also included the extra 2 contenders for the “who knows” list:  NC 15 and  NH 4,  plus 2 Republican leaners,  GA 16 and OH 18,  both with sizable EVs.    All total  these nine states have 145 electoral votes and will decide the election.

As far as the solid Republican vs Democrat vote,  I think the Democratic candidate begins more solid support.  In the link given below, the safe EV for Democrats varies from 183 to 209.  The Republicans can count on a safe 125 EV although there is certainly an upside to this.  If we look at states which went Republican since year 2000, the EV count is 179.  See link below.

Following Rules 1 and 2 are important.  I’d like to add this final rule.

Rule 3:  Election forecasts do not necessarily get better with time.    Forecasts showing one candidate to win,  can actually help the opposing candidate.

My case in point is all the polls in 2016 showed Hillary Clinton would win Florida.  But they all showed the race to be very close.   The candidate may be popular but that’s not enough – see Rule 1.   Hillary Clinton was widely predicted to win the 2016 election and this gave Trump supporters more incentive to vote.

Every time a candidate appears to be ahead in a swing state, the opposing candidate will double their efforts.  The “close the gap” strategy precludes any landslide elections.    Each candidate will target the swing states with every trick in the book.

Stay tuned,

Dave

Links:

Moody’s Model

270toWin.com

Wikipedia: Presidential elections


Trump’s impeachment

Do I dare go there?  There is some excellent coverage already, and I just can’t see adding much.  I believe this scenario:  House will vote in favor of impeachment.  Trump and his supporters will immediately claim they did because they knew that they’ll never win at the polls in 2020, and will stop at nothing to throw him out.   The Senate will fail to get the 2/3 needed and the rest is history.

I’ll let others figure out how this affects Trump’s popularity.   So far Gallup polls don’t show much change up or down.  I would like the time spent discussing other important issues.

Stay tuned,

Dave


No impeachment of Trump

Sometimes Fareed Zakaria gets things so right, there is little for me to add.  Anything extra would simply cloud the issue.

It is right of Congress to remove an elected president who has committed “high crimes and misdemeanors”  however 2/3 of the Senate must find the president guilty.    The trial of Bill Clinton in the Senate didn’t come close to this.  The vote for obstruction of justice was 50 guilty votes and 50 votes not guilty votes.  Voting was along party lines.

Trial by impeachment is direct opposite of a legal trial under our judicial system.   Our legal system provides numerous protections to the accused, to ensure a fair trial.   If the protections have not been afforded to the accused, then there can be justice at the appellate level.   Impeachment begins with a deeply partisan jury,  the US Senate.  The Senate is controlled by Republicans, and there is absolutely no doubt of acquittal, if it ever got to this stage.

The “high crimes and misdemeanors” criteria has been discussed many times and it is still controversial what the founders meant by this clause.  However,  the “high” is not used to mean a serious or severe crime, but rather one that is done by a “high official”  in his official capacity.

There’s nothing wrong with investigation, to keep us informed our president.  I know we can do better, in 2020.

Trump will fight back for sure.

Read Fareed Zakaria’s comments:

Impeachment Would Only Increase The “Class Resentment That Feeds Support For Trump”

Stay tuned,

Dave


Trump’s Approval Rating

There a lot of nonsense out there.   Here’s the honest truth – Trump’s approval ratings have hardly changed since about six months after he became president.   His approval rating based on Gallup polling is 40% for the last week in December.   The wall, the shutdown, Secretary Mattis resignation,  the sudden pull out from Syria, more Mueller news and a dozen other stories did not make a dent in Trump’s approval rating.  The fluctuations are small and just polling errors as would be expected.

In another words – there is no trend.  It has  been flat for the last 18 months.  The American people have spoken with a yawn.

You will hear from commentators how the country is deeply divided.  This is true.  Republicans will tell you that Trump is doing his level best to deliver on his promises to the electorate, and he understands the country much better than the Democrats (aka,  liberal fanatics).   They listen to Fox News.   Democrats will tell you that Trump is out of control.  They listen to MSNBC.

Finally, there is a third group, which is completely turned off by government and politics.    Remember only 43% of eligible voters actually voted in the last election.  The overload of news programs mixed with commentaries doesn’t help much.   In light of constant “breaking news”  this group just turns to the latest offerings from Netflix.

Another site I like is “538”  which puts Trump’s approval rating at 41.2%.   They aggregate various polls to provide a weighted average.

This is in sharp contrast to other presidents who had much more fluctuations in their polling numbers.  It looks like what really gets the apathetic group to turn off Netflix and other distractions is a major war – like the Korean war or Vietnam.  George H.W. Bush had one of the highest ratings when he defended Kuwait against the Iraqi invasions.   Truman has a record low rating (22%) when the Korean war dragged on.

For Trump,  polls consistently show very high approval ratings from Republicans and low ones from Democrats.  So, are Americans outraged by Trump’s shutdown the government or  the Democrats refusal to provide funds for the wall.   Likely it’s both plus a lot of who cares.  I am much more concerned with the “who cares” group, as democracies need an informed populace.

Stay tuned,

Dave

Trump’s approval rating

I heard on MSNBC that Trump’s approval rating had slumped to 37% and that among Republicans, his approval rating was around 76%.   The problem with these numbers, is they come from a small sample, conducted by phone.  These values will randomly fluctuated due to the small sample and other problems inherent in statistical sampling.

I like the Gallup Presidential Approval Polls.   They’ve been in this business for decades.    They show a 38% approval rating as of November 11, 2018, while on Oct 21, 2018,  Trump was at 44%.   Is this significant?   I examined the charts from the first poll until now, and I don’t see any real trend, except a bit of drop off in his first few days in office.    I feel this is more random fluctuation, and I would just average them – resulting in about a 41% approval rating.

Looking just at the two major parties, our country evenly split 50/50.   Republicans gave him a 89% approval rating and Democrats only  7% approval rating.   On this basis, his rating should be around 48%.   I believe it’s the independents that bring his approval ratings down a bit, as their approval of Trump is only 34%.

What is remarkable about Trump’s approval ratings, is how little they have changed over time  in comparison to other presidents.   Every president in the last years has had more volatility in their approval ratings.    It usually takes a major conflict to push approval ratings below 30%.  Truman approval rating was 87% when he assumed office following the death of President Roosevelt but hit a low of 22% as the Korean war dragged on in 1952.    Even Democrats disapproved of Truman during the Korean war, with a lowest approval of 35% in April 1951.

I just want to clear the record on Trump’s approval ratings,   No plunges or soaring to new heights.   No clear trendline, up or down.   See links at bottom.

Can an unpopular president win an election?   Sure.  Only 43% of all eligible votes participated in the last election.   This makes a big difference.

Stay tuned,

Dave

Links:

Gallup poll on Trump


Trump’s Approval Rating

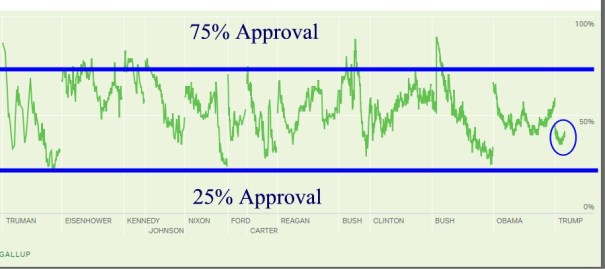
The Gallup poll has surveyed the president’s approval rating for 13 presidents from Truman to Trump.   Arbitrarily,  I’ve decided that a 75% approval means that there is strong support for the president’s recent decisions.  Getting above 75% is tough, and it doesn’t last long.      I drew a 25% approval line, which shows only three presidents hit this line or were really close:   Truman, Nixon and George W. Bush.    These were presidents during the Korean, Vietnam and Iraq wars.   But,  Nixon’s sharp drop in popularity was tied to Watergate.

So,  let’s make this real easy.  Over 75%, the country loves their president (more or less) and under 25%, we hate our president.   In between these two extremes,  a well liked president is able to be above the 50% line, and a not so liked president will be under 50% approval.    Many presidents start at high approvals  and go into a slump towards  the end of the term.   This is true for all presidents,  except Clinton, who started low and ended high.

Three presidents (Truman, Nixon, and George W.  Bush) all went above the 75% “we love you” line and managed to end their term very close to the 25% “we hate you” line.   Truman still holds the record of low approval rating, at 22%, with a slight uptick towards the end of his term, which ended in Jan 1953.     Eisenhower ended the Korean conflict, and enjoyed a number of  pops over the “we love you” line.

All this makes sense, as a president has a certain “honeymoon period” where people are cutting him a lot of slack because he’s new on the job.  After some time, and finding out that everything the candidate promised, is not what the president elect can deliver, there should be disappointment in the president.

So, let’s get to Obama’s line,  going into a slump about two years into his first term, crossing below 50%, but crossing back above 50% towards the end.   Of course, Obama got very  high ratings from Democrats and very  low ratings from Republicans.

What really distinguishes Trump’s approval rating, is the lack of variation, as compared to all the other presidents.  He started at 45% approval rating in his first 9 days in office, which dropped to 35% in August 2017, and the most recent surveys show a 42% rating (as of May 6, 2018).

There has certainly been a lot of misinformation out there, coming  particularly from Donald Trump.  His approval ratings do not seem to be impacted at all by the Michael Cohen/ Stormy Daniels scandal.   One reason,  is the Republicans  still love him at an 87% approval rating, and Democrats still hate him, with a 9% approval rating.   These numbers change only a few percent with each new survey.  If the country can be assumed divided 50/50 between Republicans and Democrats, then Trump would have a 48% approval.  Independents drag down his approval,  they have only 33% approval rating of Trump.

I’m getting pretty tired of hearing about how Trump’s approval ratings have soared with minorities, particularly blacks.   There was a 15% approval rating when he was elected president, and it’s 13% now.   Basically, since election day,  they have hated him.   Obama had a 91% approval rating and it stayed pretty much that way throughout his term.   Hispanics also hate Trump with a 22% approval rating, that is basically a flat line, never once crossing above 25% line.   Obama’s approval rating with Hispanics varied,  from 85% to 44%,  so he wasn’t consistently above the “we love you” line.

So, all this stuff about Trump being more popular with blacks or Hispanics  is nonsense.   When approval ratings are very low, there is more statistical variation of the results, particularly when only one small subset is examined.   Also, some polls use only people who were registered to vote in the last election.    Or they survey people who say they intend to vote in the next election.   These factors can make a difference.

Obama never got a “we love you” or “we hate you”  approval rating, and I suspect this will never happen with Trump.   Obama followed a Democratic agenda, had extremely strong support from Democrats,  and very little support from Republicans.  Vice versa with Trump, but the outcome is similar, a lack of variation in poll numbers, as compared to prior presidents.    Perhaps in the past, we focused more on the president himself and now it is more the party’s policy he represents.

Stay tuned,

Dave

Politifact.com: Trump’s False claim that his presidential approval rating is ‘not bad’

Politifact.com:  Donald Trump’s misleading claim that Kanye West’s praise doubled his African-American support

Gallup Poll on Presidential Approval Ratings

The 538 website compares Trump’s popularity (green line) with the 12 prior presidents.

https://projects.fivethirtyeight.com/trump-approval-ratings/

NYT: Trump Falsely Claims His Approval Among Black Americans Has Doubled

Is Donald Trump’s Approval Rating the Lowest in Recent History Before an Inauguration?

Trump’s Popularity

Since the start of his presidency, Trump has gotten fairly low approval ratings from Gallup Poll, generally between 33 to 45% approval ratings.  But this isn’t the worst ratings by far.   Harry Truman (22%) and George W. Bush (25%) still hold the record in lowest  approval ratings during their time in office.

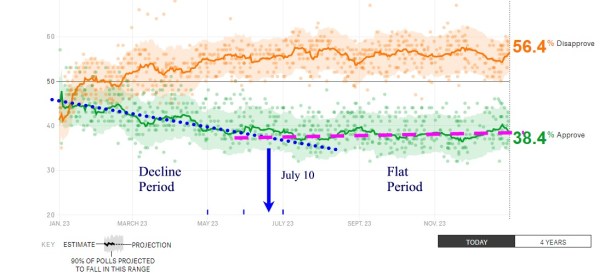
There is a tendency to relate Trump’s popularity to the news of the day, and I think this is unwarranted from survey data.  Basically,  the distinguishing feature of Trump’s approval rating has been how little reaction there has been to any news, positive or negative.   The graph below comes from an excellent website, fivethirtyeight.com which combines polls from various organizations.   I also examined the Gallup poll on approval ratings which has very similar results.

I consider two periods,  a declining trend from around 45% to 38% approval in the first 6 months of his presidency, and then basically a flat period after that. The intersection of these two trendlines is shown as July 10, 2017  is a bit arbitrary, and one can easily make a case for the flat period beginning weeks before or after this date.


Survey results will vary because the polling uses a very small sample (usually less than 2,000) and organizations will conduct surveys in different ways.  In the graph above, the range of results is shown in the lightly colored red and green shading.   The surveys are estimates of how the larger population feels about the president, approve, disapprove or no opinion/unsure.    This larger population can be the entire adult population of the US,  or the registered voters or those residents who are likely to vote in an election.  Which population is targeted can make a difference.

The links below provide good summaries of approval rating polls of President Trump for the different organizations.   One of the more surprising aspects is the variation of  the “unsure” group, from 1% to 12%.    There may  be a number of reasons for this variation.  An automated telephone poll may only allow for people to respond as approve, disapprove or unsure, while a live pollster may attempt to coax out of a respondent, a disapproval or approval rating.

The “Doubling” Story from Breitbart – Fox – Trump

Breitbart news (an online news service, which is known to be highly supportive of Trump’s policies) recently declared, “Donald Trump’s Support Among Blacks Has Doubled Since 2016, Amid Racism Claims”   followed by “Two new polls show President Donald Trump’s rising support among black voters, highlighting his political gains from pushing employers to hire Americans instead of lower-wage migrants.”   This quickly went from Breitbart to Fox News to a White House tweet as follows:

Unemployment for Black Americans is the lowest ever recorded. Trump approval ratings with Black Americans has doubled. Thank you, and it will get even (much) better! @FoxNews

By any measure, approval ratings for Trump are very low among blacks.  The “doubling” result came from using an exit poll, which showed 8% of blacks voted for Trump as compared with a recent poll by Survey Monkey, showed a 17% approval rating from black respondents.  One survey was with actual voters, and the second was done by a different organization (Survey Monkey) picking people at random from the entire population, so the results are not comparable.   Gallup polls showed Trump’s approval rating among blacks was highest just after the election (about 15%) and in the range of 10 to 14% for the next four months.  In the last six months, the approval ratings are in the range of 6 to 11% without a discernible trend.   The average in the last six months (June to December) appears to be about 8%.  When consistent survey results are compared, there is no doubling of approval, as claimed by President Trump, who was quoting Fox News, who was quoting Breitbart.

The last polling data released from Gallup on black Americans a 6% approval for the time period of Dec 25 – 31, 2017.   There’s a lot of apparent random variation in the survey numbers so I wouldn’t read much into this number, as opposed to the six month trend of 8% approval.

We tend to vote by Party and stay loyal to this party

My main point, is that if you look at either polls focused on the population in general, registered voters or specific groups, such as black Americans, there hasn’t been much variation, except what one would expect from survey inaccuracies.

Based on Gallup data,  approximately 80% of Republicans approve of Trump, while only 8% of Democrats approve of Trump.   If the country is split 50:50 between Republicans and Democrats, this would give Trump an approval rating of 44%,  which is what he had at the beginning of his term.  The 2016 popular vote, would certainly support the idea of a nearly even split  between parties.   So, each party must some how win over the undecided vote, while still maintaining their base.

I tend to believe Trump supporters voted consistently for Republicans, while Clinton supporters voted consistently for Democrats.  So,  it’s more of a loyalty to the party’s agenda than the individual running the country,.

Generic Balloting

The polling organizations are attempting to assess the outcome of  the  2018 Congressional Elections by asking respondents,  whether they would be likely to vote for candidates from the Republican or Democratic party.   The question posed to respondents may also be which party they would like to see control Congress.  This is referred to as Generic  Ballot.   So far, polling has shown Democrats lead Republicans (46% to 39%),  but a lot can change before November.   In the last few weeks, Republicans seem to be edging higher, but there is a lot of variation in the data, so it would be very premature to consider this a trend.

Stay tuned,

Dave


Links:

https://en.wikipedia.org/wiki/United_States_presidential_approval_rating

http://news.gallup.com/interactives/185273/r.aspx?g_source=WWWV7HP&g_medium=topic&g_campaign=tiles

http://www.breitbart.com/big-government/2018/01/14/donald-trump-support-from-blacks-spikes-amid-racism-claims/

https://projects.fivethirtyeight.com/congress-generic-ballot-polls/?ex_cid=rrpromo